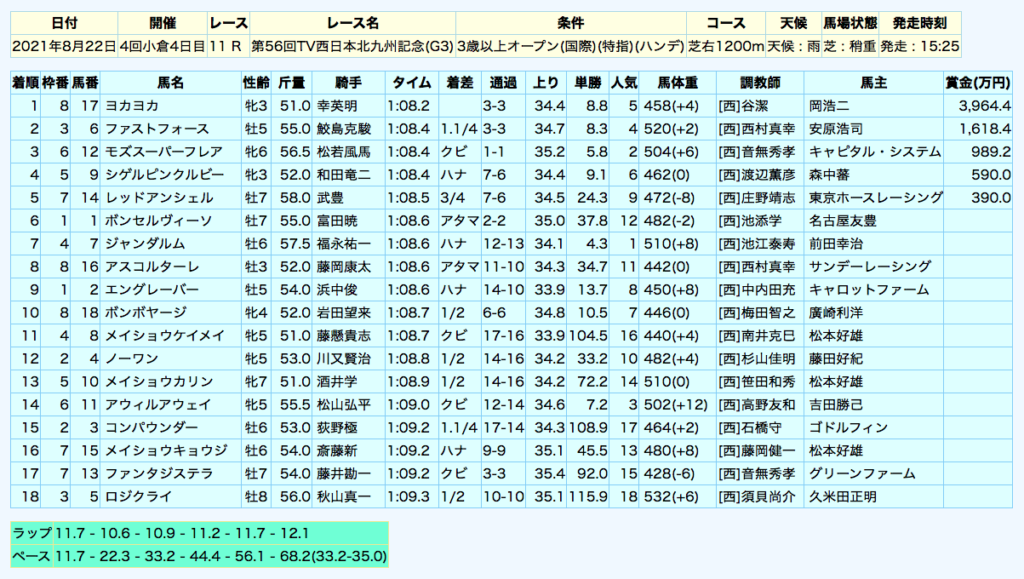
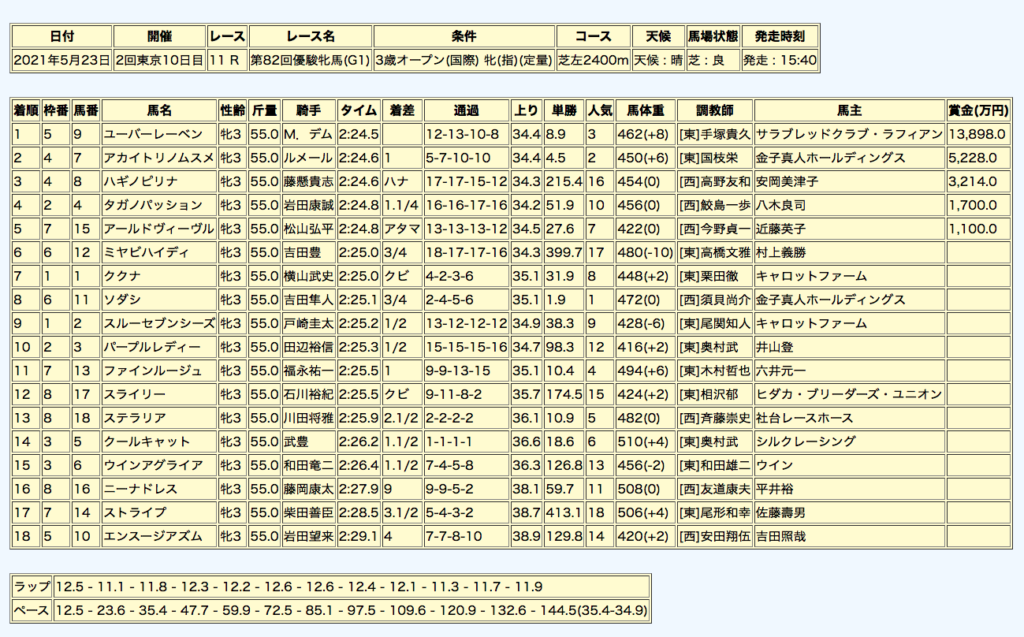
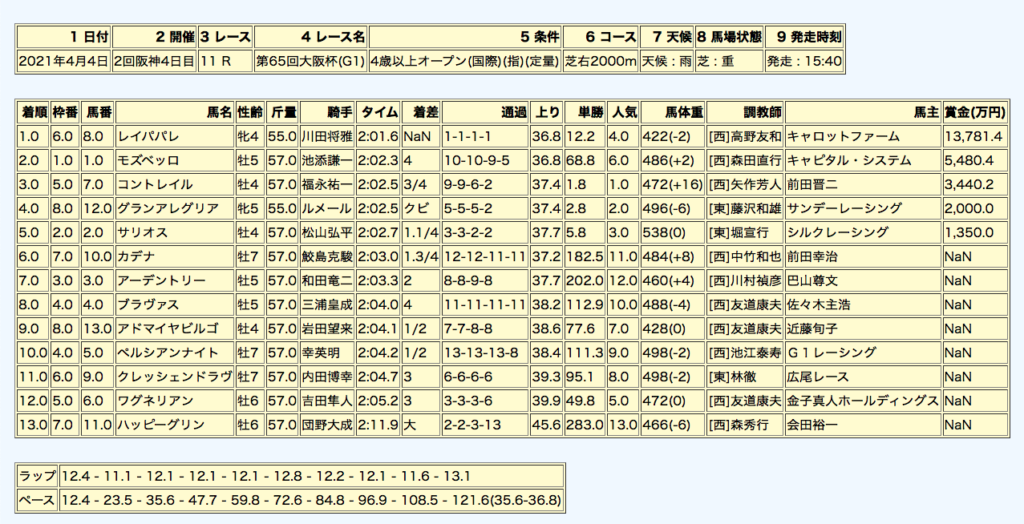
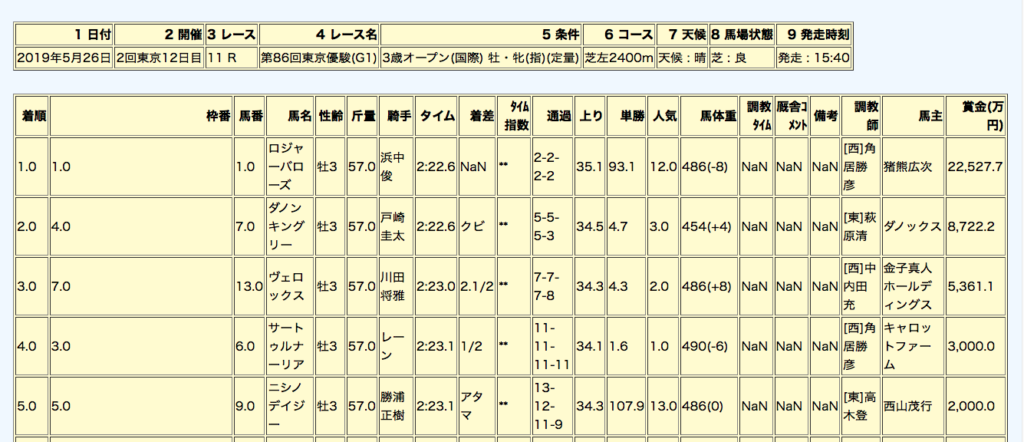
HTMLの各tableにidを付けて色設定等を変えてみました。
同じ文字列(class=”dataframe”)をそれぞれ違う文字列(id=”tableA”他)に変えるには、このような野暮ったい方法しか思いつきませんでした。
pandasではtableの線が2重線なので1重線にして色を付けました。
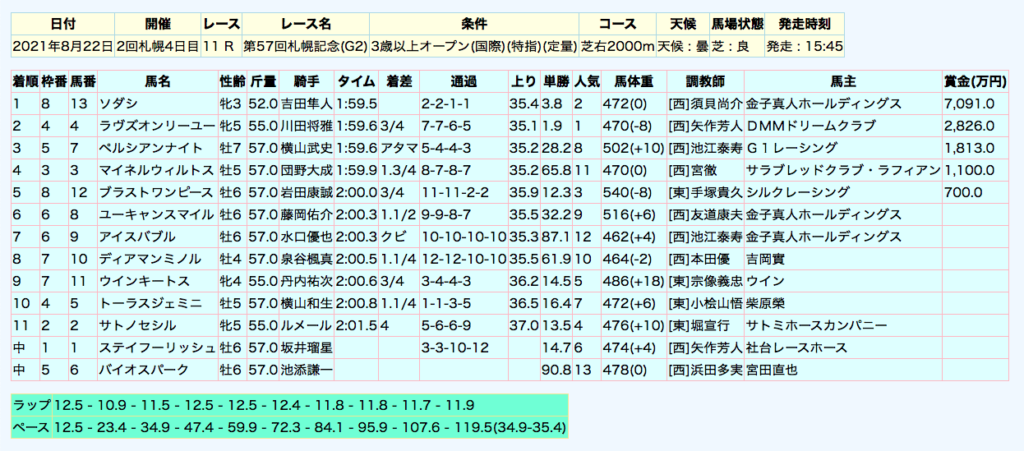
<CSVファイルの読み込み以降>

try:
    df2 = pd.read_csv(racefile_path,encoding="shift_JIS")
except UnicodeDecodeError:
    df2 = pd.read_csv(racefile_path,encoding="UTF-8")

# df2を3つのtableに分割
dfA = df2[['1 日付','2 開催','3 レース','4 レース名','5 条件','6 コース','7 天候','8 馬場状態','9 発走時刻']]
dfB = df2[['着順','枠番','馬番','馬名','性齢','斤量','騎手','タイム','着差','通過','上り','単勝','人気','馬体重','調教師','馬主','賞金(万円)']]

dfB2 = dfB[:-3]
dfC = dfB[-2:]
print(dfC)

dfC2 = dfC[['着順','枠番']]
print(dfC2)

# dfAのデータ行のみ抽出
row_num = len(df2)-3
print(row_num)

# データ行以外の行番号をリスト化
row_list = [row for row in range(0,row_num + 3) if not row==row_num]
print(row_list)

dfA2 = dfA.drop(dfA.index[row_list])
dfA3 = dfA2.rename(columns={'1 日付': '日付','2 開催': '開催','3 レース': 'レース','4 レース名': 'レース名','5 条件': '条件','6 コース': 'コース','7 天候': '天候','8 馬場状態': '馬場状態','9 発走時刻': '発走時刻'})

dfB3 = dfB2.fillna('')
print(dfB3.dtypes)

try:
    dfB3['着順'] = pd.to_numeric(dfB3['着順'], downcast='signed')
except Exception as e:
    print(e)

dfB3['枠番'] = pd.to_numeric(dfB3['枠番'], downcast='signed')
dfB3['馬番'] = pd.to_numeric(dfB3['馬番'], downcast='signed')
dfB3['人気'] = pd.to_numeric(dfB3['人気'], downcast='signed')
print(dfB3.dtypes)

html_string = '''
<html>
    <head>
        <meta charset="UTF-8">
        <title>{raceID}</title>
        <link rel="stylesheet" href="style.css">
    </head>
    <body>
        <div class="container">
            {tableA}
            {tableB}
            {tableC}
        </div>
    </body>
</html>
'''

with open(html_file,'w') as f:
    f.write(html_string.format(tableA=dfA3.to_html(index=False),tableB=dfB3.to_html(index=False),tableC=dfC2.to_html(index=False,header=False),raceID=raceID))

with open(html_file,'r') as f:
    html = f.read()

htmlH = html.split('<table border="1" class="dataframe">')[0]
htmlA = html.split('<table border="1" class="dataframe">')[1]
htmlB = html.split('<table border="1" class="dataframe">')[2]
htmlC = html.split('<table border="1" class="dataframe">')[3]

htmlA2 = '<table id="tableA" border="1" style="border-collapse: collapse; border-color: #add8e6">' + htmlA
htmlB2 = '<table id="tableB" border="1" style="border-collapse: collapse; border-color: #ffb6c1">' + htmlB
htmlC2 = '<table id="tableC" border="1" style="border-collapse: collapse; border-color: #f0e68c">' + htmlC

html_new = htmlH + htmlA2 + htmlB2 + htmlC2

with open(html_file,'w') as f:
    f.write(html_new)
body {
    background-color: #f0f8ff;
}
th {
    text-align: center;
    }
.container {
    display: block;
}
#tableA{
    background-color: #ffffe0;
    margin: 15px 5px 15px 5px;
}
#tableB{
    background-color: #e0ffff;
    margin: 15px 5px 15px 5px;
}
#tableC{
    background-color: #7fffd4;
    margin: 15px 5px 15px 5px;
}
