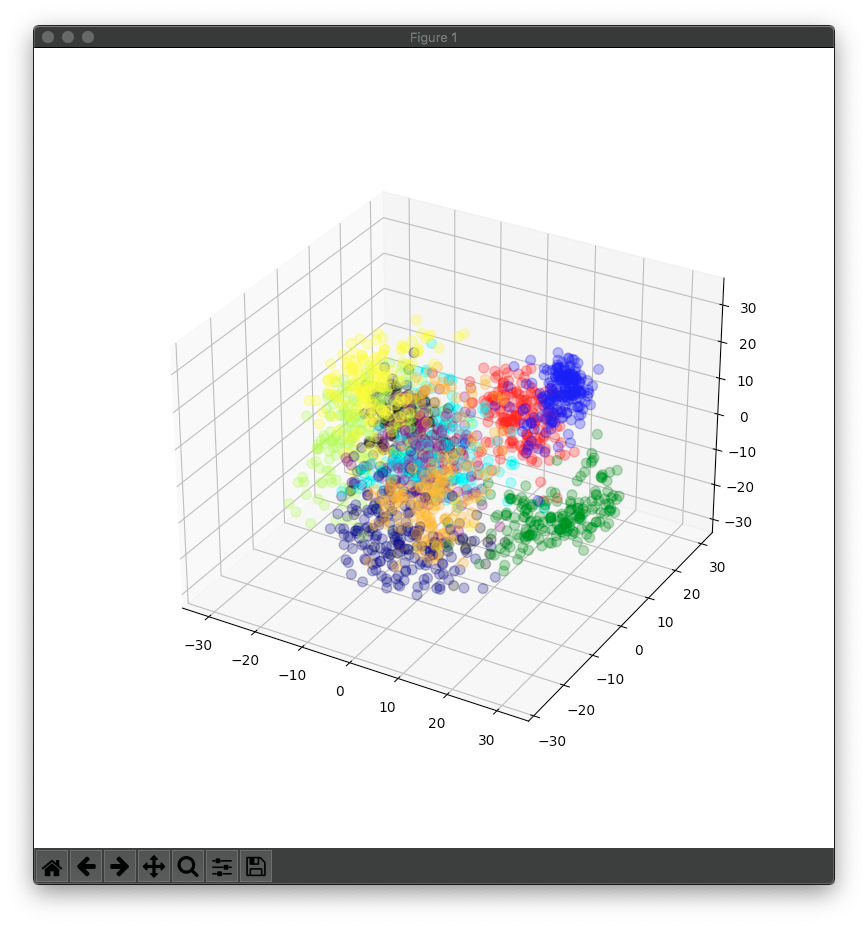
手書き数字画像のデータセットについて64因子を3因子に減らし、3D散布図を描画しました。
分かりやすくするためとは言え、elifが8つも連なるようなコードは書かない方がいいと思います(教本P232)。AI専業であっても最低限のコーディング力は必要でしょう。
from sklearn import decomposition
from sklearn import datasets
import matplotlib.pyplot as plt

def getcolor(num):
    color_list = ['red','orange','yellow','greenyellow','green','cyan','blue','navy','purple','black']
    return color_list[num]

# 手書き数字のデータをロード
digits = datasets.load_digits()

# 画像データを変数all_featuresに、画像内容(数字)を変数teacher_labelsに格納
all_features = digits.data
teacher_labels = digits.target

# 主成分分析(3因子に減らす)
pca = decomposition.PCA(n_components=3)

# 64因子のall_featuresを3因子のthree_featuresに変換
three_features = pca.fit_transform(all_features)

# figureオブジェクト作成サイズを800*800とする
fig = plt.figure(figsize=(8, 8))

# 1*1グリッドのサブプロット1に3D描画する
subfig = fig.add_subplot(111, projection = '3d')

# teacher_labelsに対応する色のリストを作成
colors = list(map(getcolor, teacher_labels))

# データの3Dカラー散布図描画設定
subfig.scatter(three_features[ : , 0 ], three_features[ : , 1 ], three_features[ : , 2 ], s=50, c=colors, alpha=0.3)

# グラフを表示
plt.show()