[Python] AI 06 手書き数字の認識 不正解画像の表示

前回の続きです。

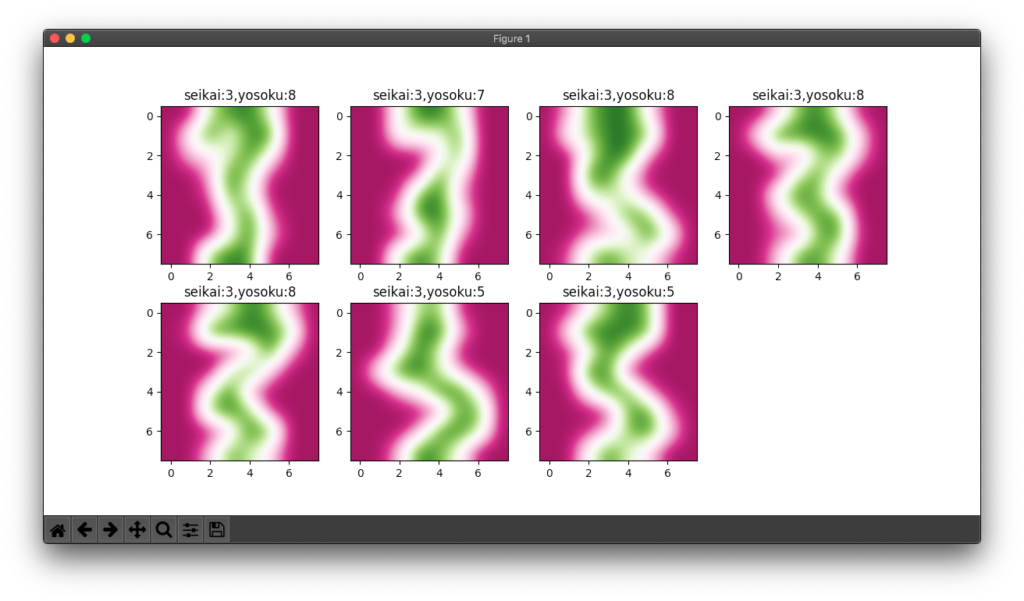
不正解が多かった3の該当画像を一括表示しました。確かに間違えやすい書き方だということが分かります。

from sklearn import datasets
import sklearn.svm as svm
import matplotlib.pyplot as plt

# 手書き数字のデータをロード
digits = datasets.load_digits()

# 画像データを変数all_featuresに、画像内容(数字)を変数teacher_labelsに格納
all_features = digits.data
teacher_labels = digits.target

num_samples = len(all_features)

model = svm.SVC(gamma = 0.001)

# 学習用の学習データと正解データ(1500個)
train_features=all_features[ : 1500 ]
train_teacher_labels=teacher_labels[ : 1500 ]
print(len(train_features))

# 検証用の学習データと正解データ(297個)
test_feature=all_features[1500 : ]
test_teacher_labels=digits.target[1500 : ]
print(len(test_feature))

# 学習実行
model.fit(train_features,train_teacher_labels)

# 数値予測データと検証用画像データ
predicted = model.predict(test_feature)
test_images = digits.images[1500 : ]

# 図のサイズ設定
fig = plt.figure(figsize=(12, 6))

# 前回記事で不正解が多かった3の画像で不正解のものを表示する
i = 1
for la,pre,img in zip(test_teacher_labels,predicted,test_images):
    if la == 3 and la != pre:
        plt.subplot(2, 4, i)
        plt.imshow(img, cmap='PiYG', interpolation='bicubic')
        plt.title(f'seikai:{la},yosoku:{pre}')
        i = i + 1

plt.show()
[Python] AI 05 手書き数字の認識 SVCによる予測

手書き数字の画像データ群を使ってSVCで学習させ、学習能力を検証しました。

digitsデータ1797個の内、1500個を学習、297個は検証に使いました。正解率は3の読み間違いが多いという結果でした。

ただdigits.dataというフラットなデータがあるにもかかわらず、何故わざわざ入れ子リストのdigits.imagesを平滑化するのかが分かりませんでした。

from sklearn import datasets
import sklearn.svm as svm
from sklearn.metrics import confusion_matrix
from sklearn.metrics import classification_report

# 手書き数字のデータをロード
digits = datasets.load_digits()

# 画像データを変数all_featuresに、画像内容(数字)を変数teacher_labelsに格納
all_features = digits.data
teacher_labels = digits.target

num_samples = len(all_features)

model = svm.SVC(gamma = 0.001)

# 学習用の学習データと教師データ(1500個)
train_features=all_features[ : 1500 ]
train_teacher_labels=teacher_labels[ : 1500 ]
print(len(train_features))

# 検証用の学習データと教師データ(297個)
test_feature=all_features[1500 : ]
test_teacher_labels=digits.target[1500 : ]
print(len(test_feature))

# 学習実行
model.fit(train_features,train_teacher_labels)

# 正解と数値予測データ
expected = test_teacher_labels
predicted = model.predict(test_feature)

print(f"分類機による分類結果 {model}: \n {classification_report(expected, predicted)} \n")

print(f"コンフュージョンマトリックス:\n {confusion_matrix(expected, predicted)}")
--------------------------------------------------

出力
--------------------------------------------------
1500
297
分類機による分類結果 SVC(gamma=0.001): 
               precision    recall  f1-score   support

           0       1.00      0.96      0.98        27
           1       0.97      1.00      0.98        31
           2       1.00      1.00      1.00        27
           3       0.96      0.77      0.85        30
           4       0.97      0.91      0.94        33
           5       0.91      1.00      0.95        30
           6       1.00      1.00      1.00        30
           7       0.97      1.00      0.98        30
           8       0.79      0.96      0.87        28
           9       1.00      0.94      0.97        31

    accuracy                           0.95       297
   macro avg       0.96      0.95      0.95       297
weighted avg       0.96      0.95      0.95       297
 

コンフュージョンマトリックス:
 [[26  0  0  0  1  0  0  0  0  0]
 [ 0 31  0  0  0  0  0  0  0  0]
 [ 0  0 27  0  0  0  0  0  0  0]
 [ 0  0  0 23  0  2  0  1  4  0]
 [ 0  0  0  0 30  0  0  0  3  0]
 [ 0  0  0  0  0 30  0  0  0  0]
 [ 0  0  0  0  0  0 30  0  0  0]
 [ 0  0  0  0  0  0  0 30  0  0]
 [ 0  1  0  0  0  0  0  0 27  0]
 [ 0  0  0  1  0  1  0  0  0 29]]