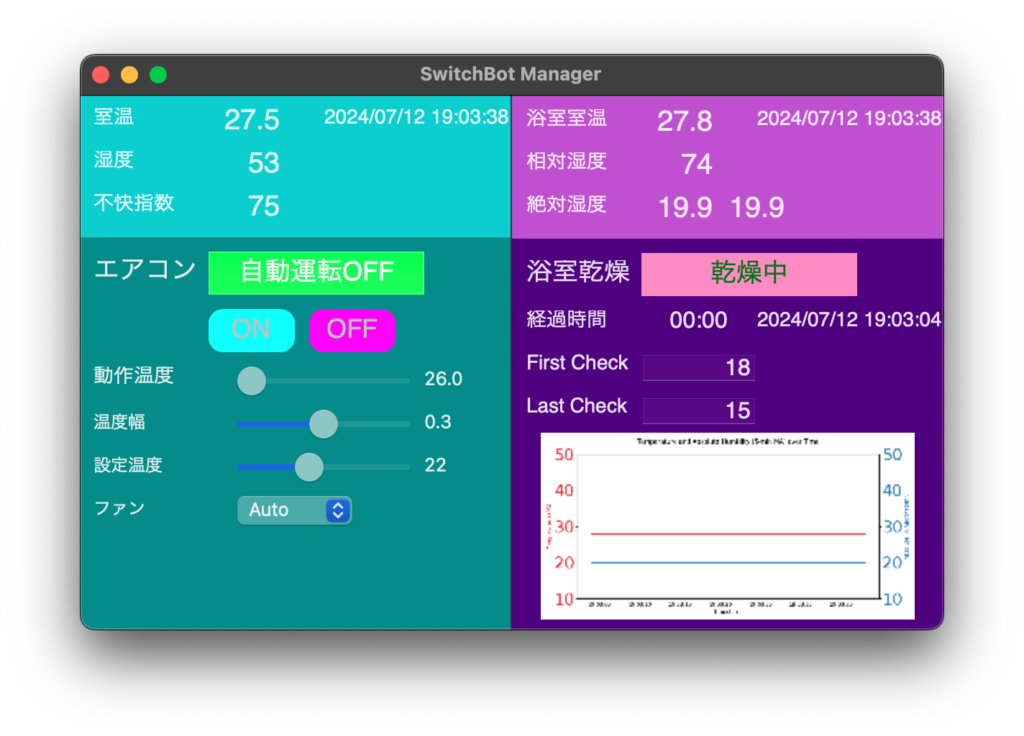
[Mac M2 Pro 12CPU, Sonoma 14.5, wxWidgets 3.2.5]
C++にはmatplotlibライブラリに匹敵するグラフ作成ライブラリが見つからず、ラッパーであるmatplotlib-cppは古いためかアプリがクラッシュします。
Py_Initialize()などを使ってPythonスクリプトをモジュール化しましたが、wxWidgetsのonTimer関数ではうまく動作せず落ちてしまうので、スクリプトのままターミナルで実行しました。
これで絶対湿度など数値とグラフをチェックし、進捗を確認できるようになりました。

#include "CallPythonScript.h"
#include <cstdio>
#include <string>
#include <iostream>
#include <fstream>

void CallPythonScript(const std::string& csvPath, const std::string& pngPath) {
    std::string scriptPath = "GenerateGraph.py";
    std::string command = "/usr/local/bin/python " + scriptPath + " " + csvPath + " " + pngPath + " > /dev/null 2>&1";

    FILE* pipe = popen(command.c_str(), "r");
    if (!pipe) {
        std::cerr << "Failed to execute Python script" << std::endl;
        return;
    }

    int result = pclose(pipe);
    if (result != 0) {
        std::cerr << "Failed to execute Python script" << std::endl;
    } else {
        std::ifstream file(pngPath);
        if (!file) {
            std::cerr << "PNG file not found or cannot be opened" << std::endl;
        } else {
            std::cout << "PNG file created successfully" << std::endl;
        }
    }
}