[Mac M2 Pro 12CPU, Sonoma 14.5]
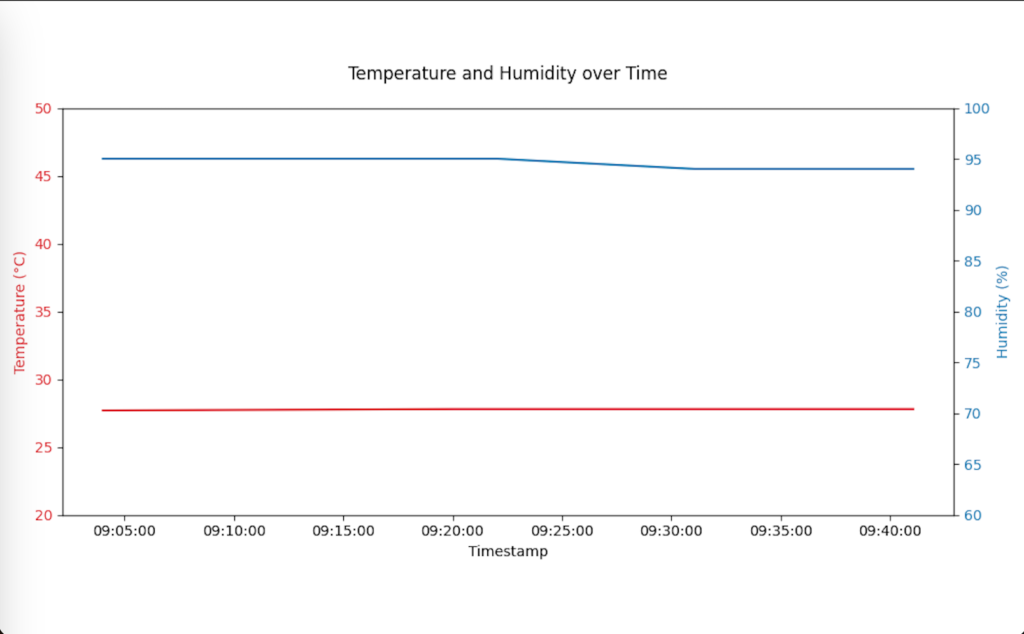
浴室の温湿度データを毎分取得し、都度グラフ化するようにしました。
以前から解決できていなかったのですが、osascriptコマンドを使ってもMacに通知を送ることができません。システム音を鳴らすこともできないです。つまりAppleScriptが動作しないです。
このスクリプトをcronに登録するスクリプトが別に必要ですが、ChatGPTに聞けば教えてくれます。
import os
import time
import json
import hashlib
import hmac
import base64
import uuid
import requests
import datetime
import pandas as pd
import matplotlib.pyplot as plt
from os.path import exists
import subprocess

dir_name = "/SwitchBot/data"

device_id = "XXX"
token = 'XXX'
secret = 'XXX'

nonce = str(uuid.uuid4())
t = int(round(time.time() * 1000))
string_to_sign = "{}{}{}".format(token, t, nonce)
string_to_sign = bytes(string_to_sign, "utf-8")
secret = bytes(secret, "utf-8")
sign = base64.b64encode(
    hmac.new(secret, msg=string_to_sign, digestmod=hashlib.sha256).digest()
)

apiHeader = {}
apiHeader["Authorization"] = token
apiHeader["Content-Type"] = "application/json"
apiHeader["charset"] = "utf8"
apiHeader["t"] = str(t)
apiHeader["sign"] = str(sign, "utf-8")
apiHeader["nonce"] = nonce

response = requests.get(
    f"https://api.switch-bot.com/v1.1/devices/{device_id}/status",
    headers=apiHeader,
)
devices = response.json()

timestamp = datetime.datetime.now().strftime("%Y%m%d%H%M%S")
response_file = f"{dir_name}/json/status_{device_id}_{timestamp}.json"
with open(response_file, "w") as f:
    json.dump(devices, f, ensure_ascii=False, indent=4)

print("Success get device status.")

# CSVファイルを作成(データ行を追加する)
timestamp_date = datetime.datetime.now().strftime("%Y%m%d")
csv_file = f"{dir_name}/{timestamp_date}_{device_id}_data.csv"

# デバイスのステータスから必要なデータを抽出
temperature = devices['body']['temperature']
humidity = devices['body']['humidity']
battery = devices['body']['battery']

# 湿度が60%以下の場合に通知を送る(動作不可)
if humidity <= 60:
    subprocess.run(['osascript', '-e', f'display notification "Humidity is {humidity}%" with title "Humidity Alert"'])

# CSVファイルにデータを追加
data = {
    'timestamp': [timestamp],
    'temperature': [temperature],
    'humidity': [humidity],
    'battery': [battery]
}

df = pd.DataFrame(data)

if exists(csv_file):
    df.to_csv(csv_file, mode='a', header=False, index=False)
else:
    df.to_csv(csv_file, mode='w', header=True, index=False)

print("Success append data to CSV.")

# CSVファイルからグラフを作成する(上書き更新)
plot_file = f"{dir_name}/{timestamp_date}_{device_id}_data_plot.png"

# CSVファイルを読み込む
df = pd.read_csv(csv_file)

# タイムスタンプをdatetime型に変換
df['timestamp'] = pd.to_datetime(df['timestamp'], format='%Y%m%d%H%M%S')

# グラフを作成
fig, ax1 = plt.subplots(figsize=(10, 5))

ax1.set_xlabel('Timestamp')
ax1.set_ylabel('Temperature (°C)', color='tab:red')
ax1.plot(df['timestamp'], df['temperature'], label='Temperature', color='tab:red')
ax1.tick_params(axis='y', labelcolor='tab:red')
ax1.set_ylim(20, 50)

ax2 = ax1.twinx()
ax2.set_ylabel('Humidity (%)', color='tab:blue')
ax2.plot(df['timestamp'], df['humidity'], label='Humidity', color='tab:blue')
ax2.tick_params(axis='y', labelcolor='tab:blue')
ax2.set_ylim(60, 100)

fig.tight_layout(rect=[0, 0, 1, 0.95])  # タイトルが切れないように調整
plt.title('Temperature and Humidity over Time', pad=20)
plt.xticks(rotation=45)
ax1.xaxis.set_major_formatter(plt.matplotlib.dates.DateFormatter('%H:%M:%S'))

# グラフを保存
plt.savefig(plot_file)
plt.close()

print("Success create plot.")