#include <wx/wx.h>
#include <wx/slider.h>
#include <wx/stattext.h>
#include <wx/choice.h>
#include <wx/panel.h>
#include <wx/sizer.h>
#include <wx/image.h>
#include <wx/bitmap.h>
#include "functions.h"
class MyFrame : public wxFrame
{
public:
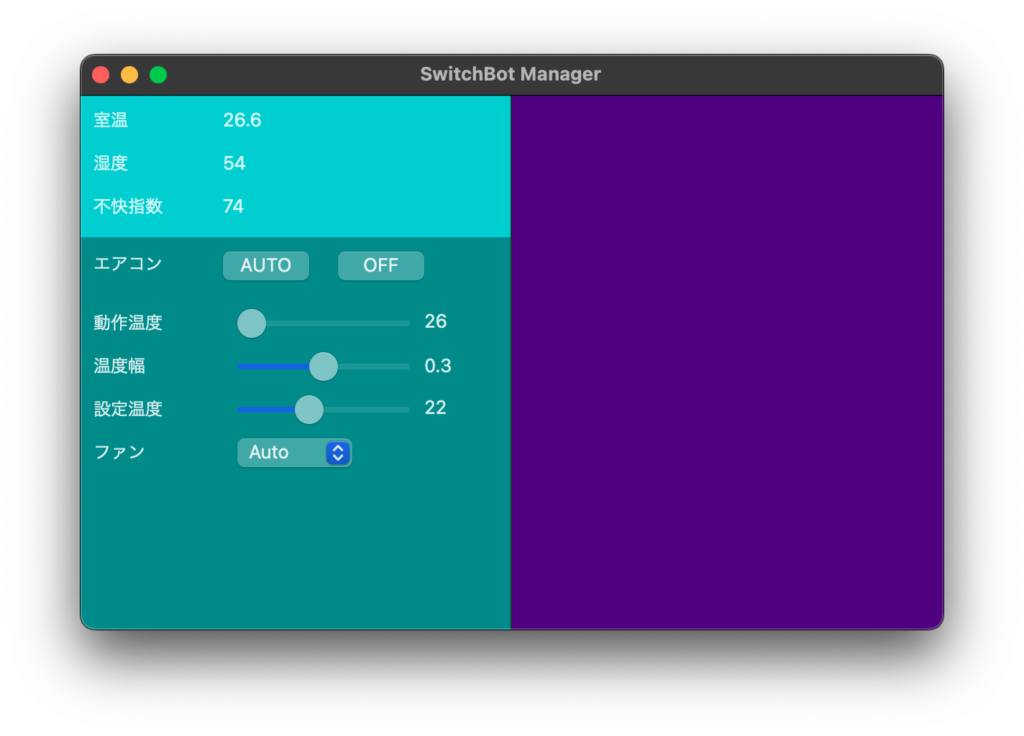
MyFrame() : wxFrame(NULL, wxID_ANY, "SwitchBot Manager", wxDefaultPosition, wxSize(600, 400))
{
// パネルを左右に分割
wxPanel* leftPanel = new wxPanel(this, wxID_ANY, wxDefaultPosition, wxSize(300, 400));
wxPanel* rightPanel = new wxPanel(this, wxID_ANY, wxPoint(300, 0), wxSize(300, 400));
// 背景色の設定
leftPanel->SetBackgroundColour(wxColour("#00CED1"));
rightPanel->SetBackgroundColour(wxColour("#4B0082"));
// 下部のパネルを追加して背景色を設定
wxPanel* bottomPanel = new wxPanel(leftPanel, wxID_ANY, wxPoint(0, 100), wxSize(300, 300));
bottomPanel->SetBackgroundColour(wxColour("#008B8B"));
// CSVからのデータ読み込み
std::vector<double> data = ReadCsvData();
// 室温と湿度
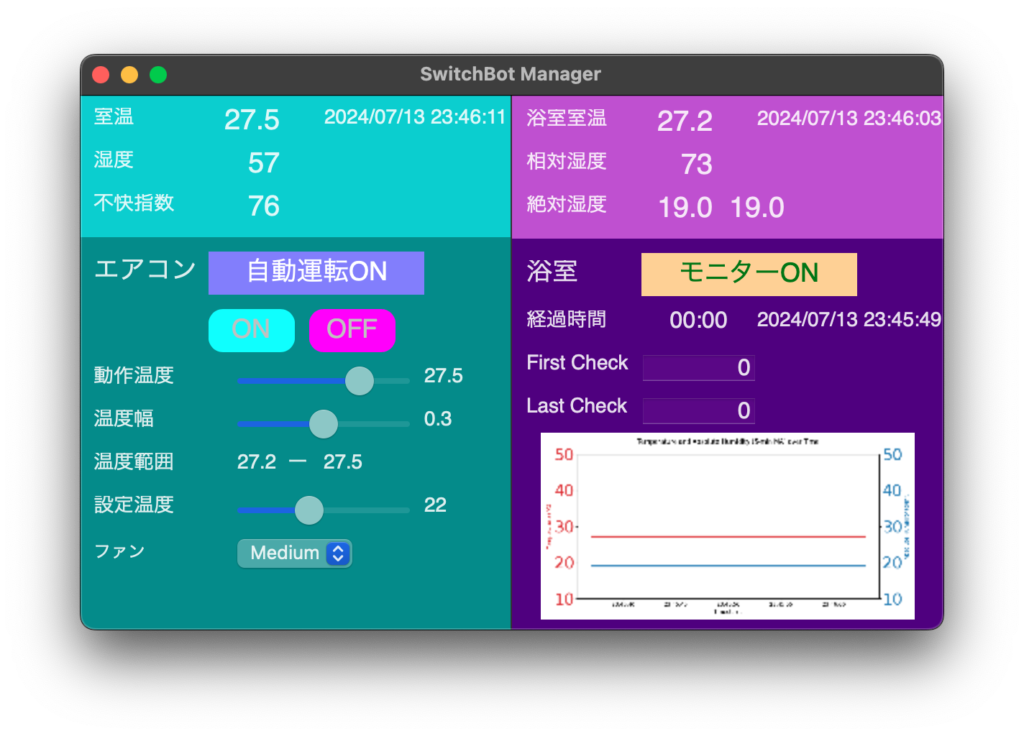
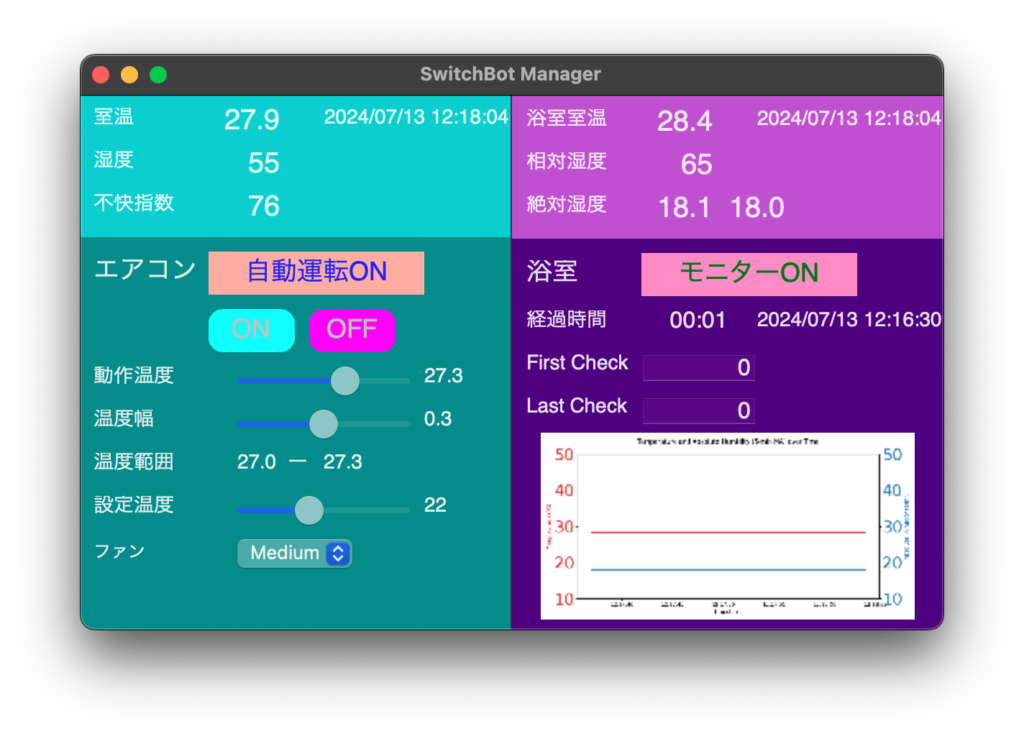
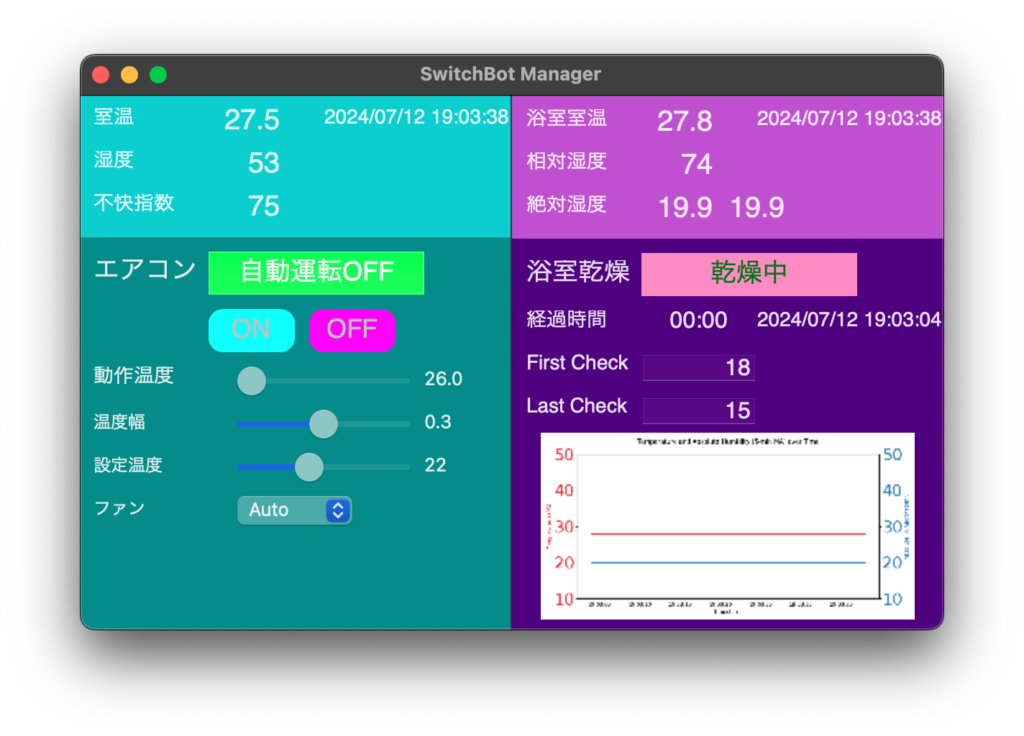
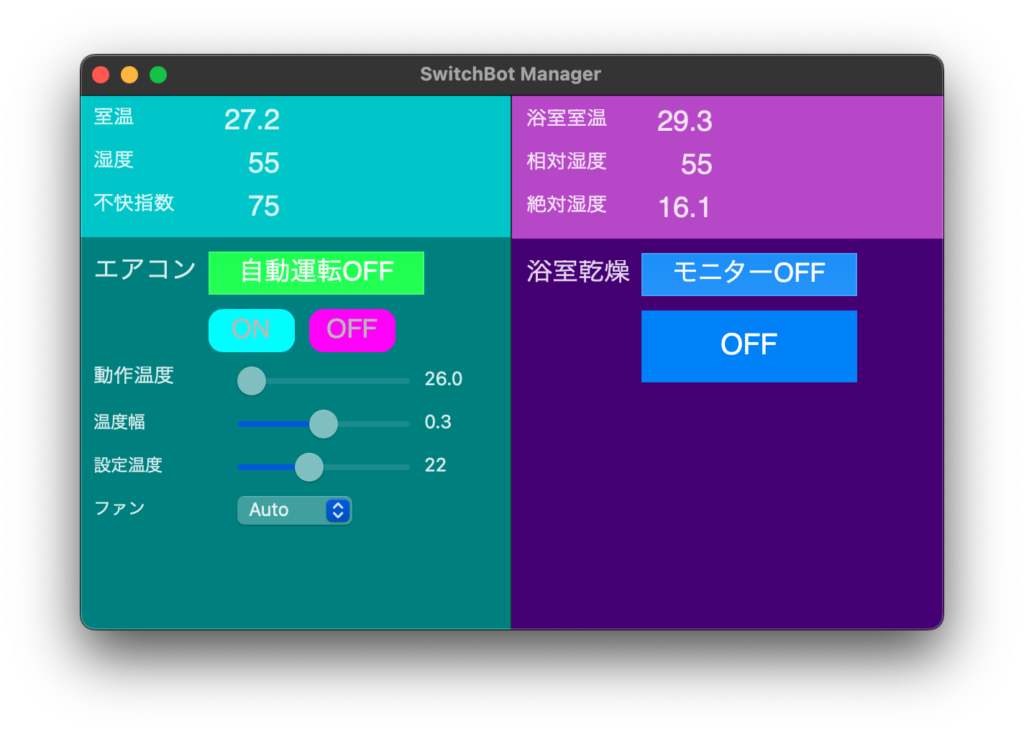
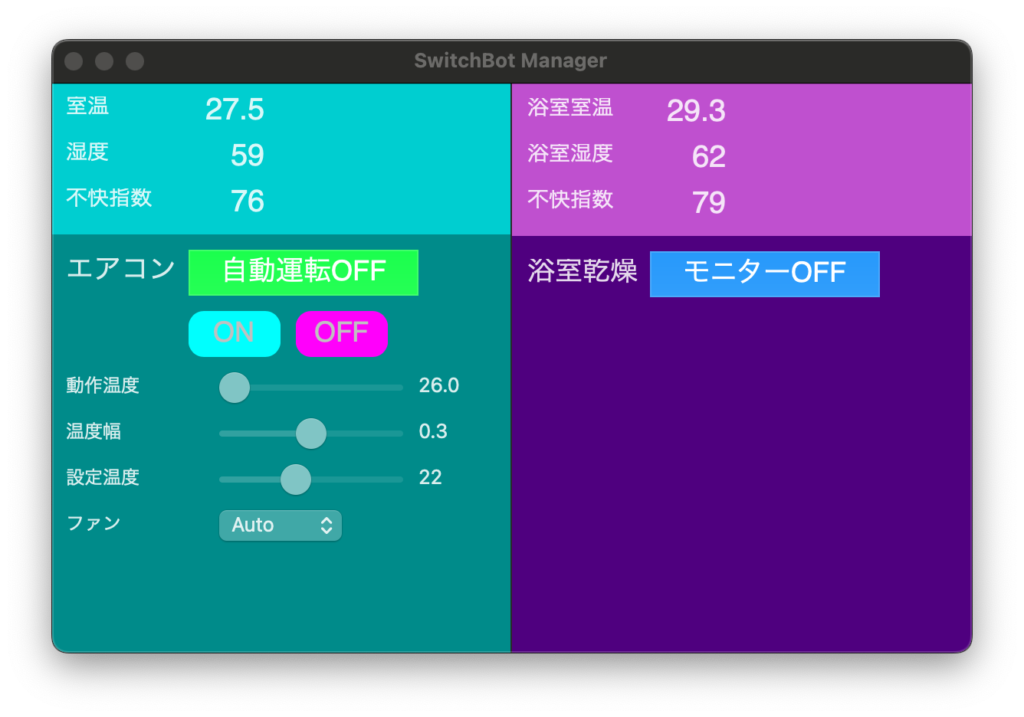
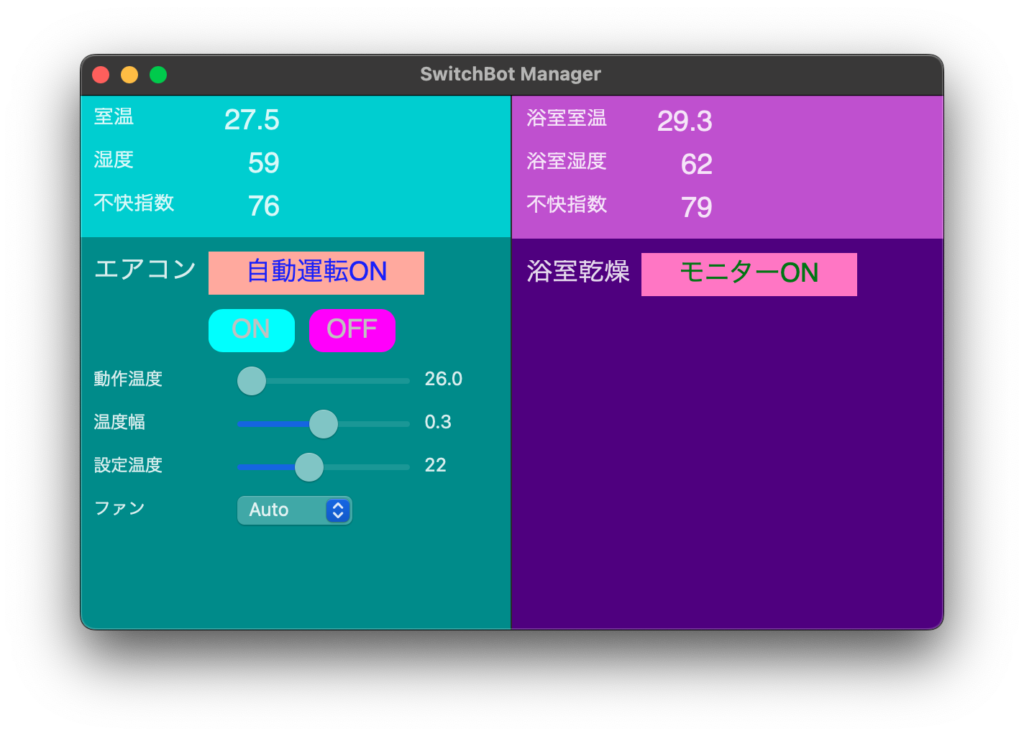
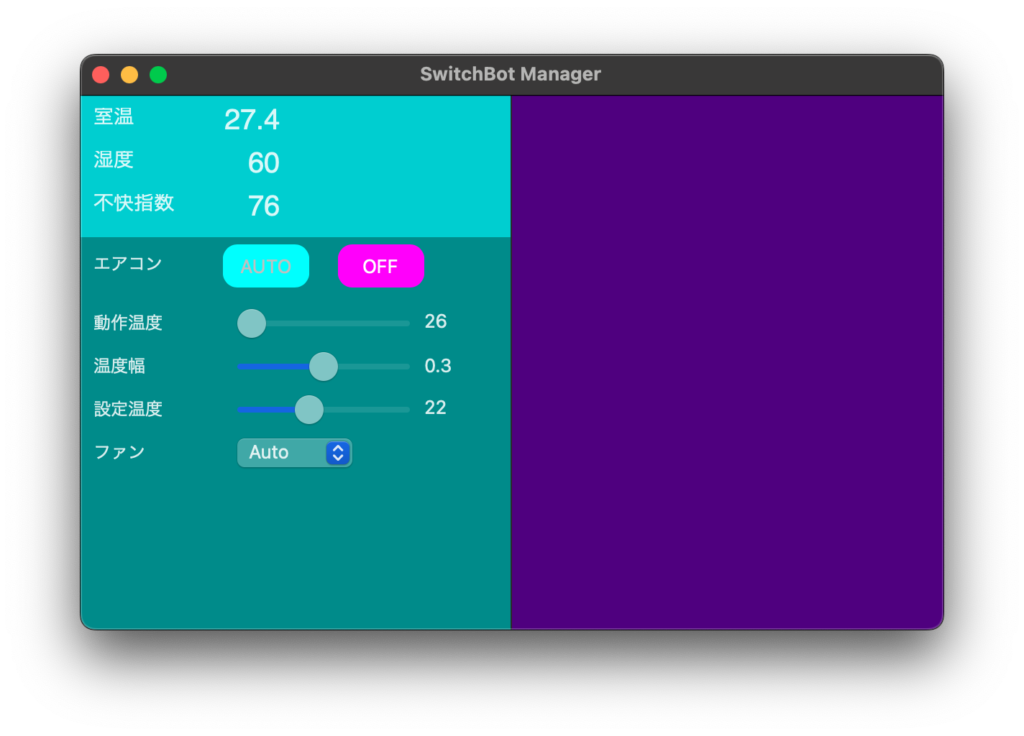
new wxStaticText(leftPanel, wxID_ANY, "室温", wxPoint(10, 10), wxSize(80, 20));
new wxStaticText(leftPanel, wxID_ANY, wxString::Format("%.1f", data[0]), wxPoint(100, 10), wxSize(80, 20));
new wxStaticText(leftPanel, wxID_ANY, "湿度", wxPoint(10, 40), wxSize(80, 20));
new wxStaticText(leftPanel, wxID_ANY, wxString::Format("%.0f", data[1]), wxPoint(100, 40), wxSize(80, 20));
// 不快指数
new wxStaticText(leftPanel, wxID_ANY, "不快指数", wxPoint(10, 70), wxSize(80, 20));
new wxStaticText(leftPanel, wxID_ANY, wxString::Format("%.0f", data[2]), wxPoint(100, 70), wxSize(80, 20));
// エアコン
new wxStaticText(bottomPanel, wxID_ANY, "エアコン", wxPoint(10, 10), wxSize(80, 20));
// AUTOボタン
new wxButton(bottomPanel, wxID_ANY, "AUTO", wxPoint(100, 5), wxSize(60, 30));
// OFFボタン
new wxButton(bottomPanel, wxID_ANY, "OFF", wxPoint(180, 5), wxSize(60, 30));
// 動作温度
new wxStaticText(bottomPanel, wxID_ANY, "動作温度", wxPoint(10, 51), wxSize(72, 18));
wxSlider* operationTempSlider = new wxSlider(bottomPanel, wxID_ANY, 26, 26, 28, wxPoint(110, 50), wxSize(120, 20), wxSL_HORIZONTAL);
wxStaticText* operationTempDisplay = new wxStaticText(bottomPanel, wxID_ANY, "26", wxPoint(240, 50), wxSize(40, 20));
// 温度幅
new wxStaticText(bottomPanel, wxID_ANY, "温度幅", wxPoint(10, 81), wxSize(54, 18));
wxSlider* tempRangeSlider = new wxSlider(bottomPanel, wxID_ANY, 3, 1, 5, wxPoint(110, 80), wxSize(120, 20), wxSL_HORIZONTAL);
wxStaticText* tempRangeDisplay = new wxStaticText(bottomPanel, wxID_ANY, "0.3", wxPoint(240, 81), wxSize(40, 20));
// 設定温度
new wxStaticText(bottomPanel, wxID_ANY, "設定温度", wxPoint(10, 111), wxSize(72, 18));
wxSlider* setTempSlider = new wxSlider(bottomPanel, wxID_ANY, 22, 20, 25, wxPoint(110, 110), wxSize(120, 20), wxSL_HORIZONTAL);
wxStaticText* setTempDisplay = new wxStaticText(bottomPanel, wxID_ANY, "22", wxPoint(240, 110), wxSize(40, 20));
// ファン
new wxStaticText(bottomPanel, wxID_ANY, "ファン", wxPoint(10, 141), wxSize(53, 18));
wxArrayString fanChoices;
fanChoices.Add("Auto");
fanChoices.Add("Low");
fanChoices.Add("Medium");
fanChoices.Add("High");
new wxChoice(bottomPanel, wxID_ANY, wxPoint(110, 140), wxSize(80, 20), fanChoices);
// Event bindings
operationTempSlider->Bind(wxEVT_SLIDER, [operationTempDisplay](wxCommandEvent& event) {
operationTempDisplay->SetLabel(wxString::Format("%.1f", event.GetInt() / 10.0));
});
tempRangeSlider->Bind(wxEVT_SLIDER, [tempRangeDisplay](wxCommandEvent& event) {
tempRangeDisplay->SetLabel(wxString::Format("%.1f", event.GetInt() / 10.0));
});
setTempSlider->Bind(wxEVT_SLIDER, [setTempDisplay](wxCommandEvent& event) {
setTempDisplay->SetLabel(wxString::Format("%d", event.GetInt()));
});
}
};
class MyApp : public wxApp
{
public:
virtual bool OnInit()
{
MyFrame* frame = new MyFrame();
frame->Show(true);
return true;
}
};
wxIMPLEMENT_APP(MyApp);