[Mac M2 Pro 12CPU, Sonoma 14.5]
開発経過をGUIで記録します。
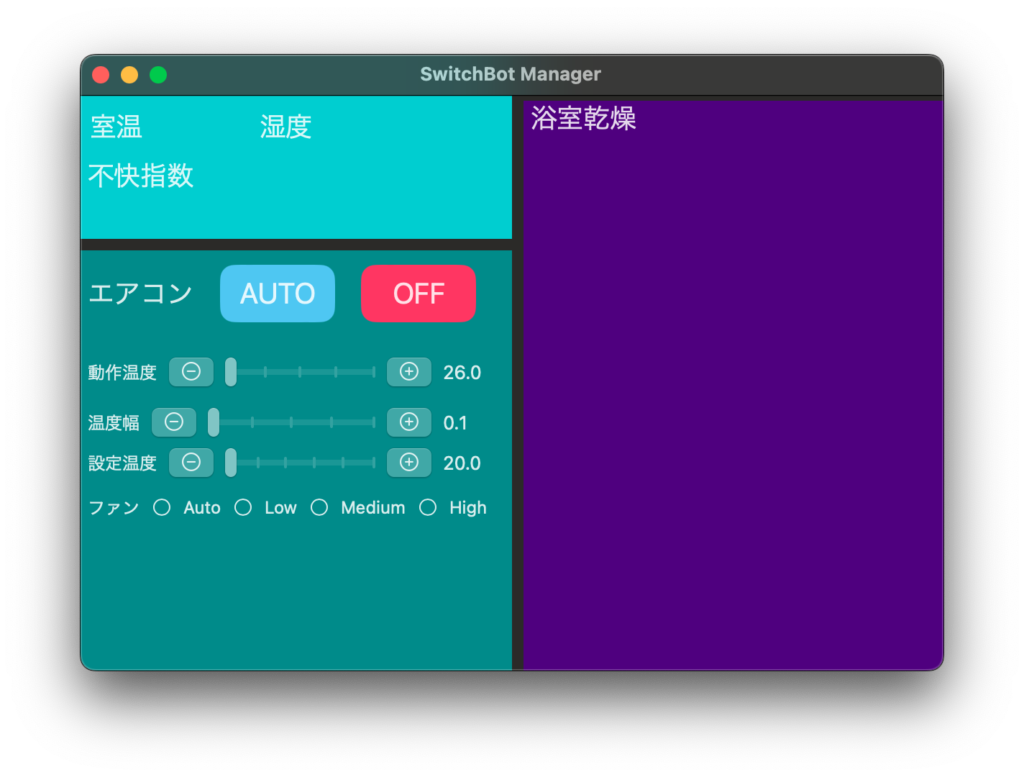
[Mac M2 Pro 12CPU, Sonoma 14.5]
開発経過をGUIで記録します。

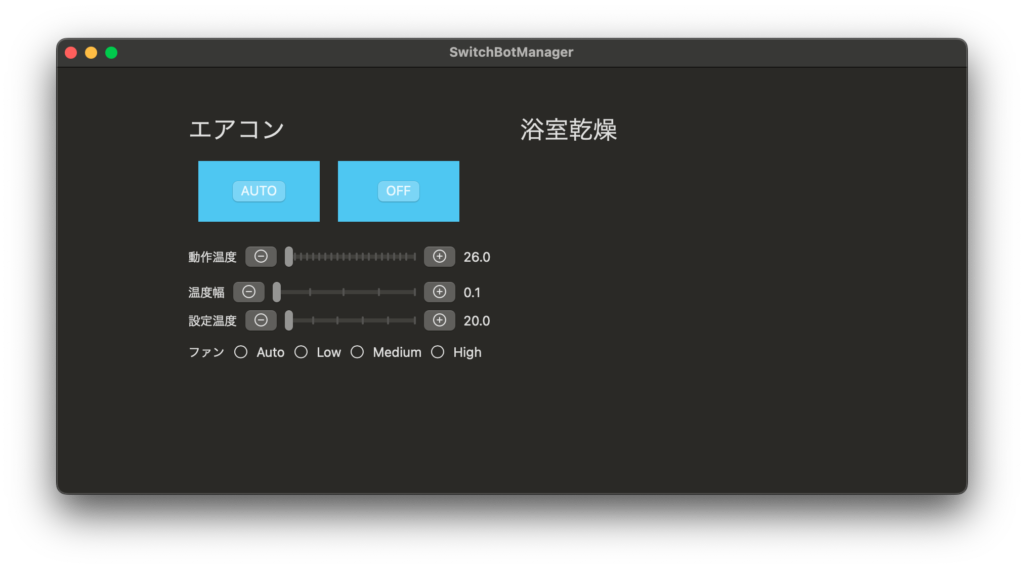
[Mac M2 Pro 12CPU, Sonoma 14.5]
FLTKのスライダーが機能不足なのでSwiftUIに変えました。
デスクトップではウィジェットの位置を座標で決めていたため、SwiftUIでVStackやHStackを使って位置決めするのはとてもやりずらいです。iOSやwatchOSでは違和感がないのですが。
[Mac M2 Pro 12CPU, Sonoma 14.5]
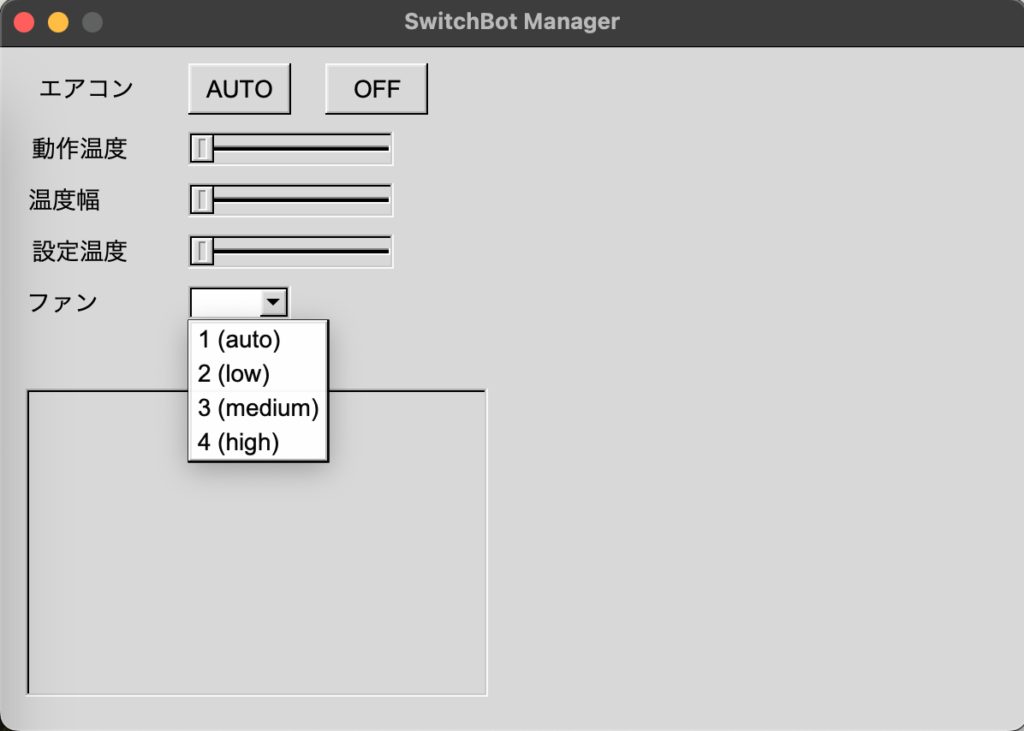
SwitchBot管理アプリMac版の製作に着手しました。手順は以下の通りです。
1.Adobe XDでGUIをデザイン。座標とサイズを自作プラグインで抽出
2.ChatGPT用プロンプトを作成しレスポンスを得る
3.手直ししたC++コードをビルド
このコードを土台に肉付けしていきます。
FLTKアプリを作成します
C++コードを考えてください
ウィンドウのサイズは600*400
各ウィジェットの座標は以下の通り
{
  "エアコングラフ": [15, 200, 270, 180],
  "ファン選択": [110, 140, 60, 20],
  "ファン": [10, 141, 53, 18],
  "温度幅表示": [240, 81, 40, 20],
  "温度幅スライダー": [110, 80, 120, 20],
  "温度幅": [10, 81, 54, 18],
  "動作温度表示": [240, 50, 40, 20],
  "動作温度スライダー": [110, 50, 120, 20],
  "動作温度": [10, 51, 72, 18],
  "OFFボタン": [190, 10, 60, 30],
  "AUTOボタン": [110, 10, 60, 30],
  "エアコン": [10, 15, 80, 20],
  "設定温度表示": [240, 110, 40, 20],
  "設定温度スライダー": [110, 110, 120, 20],
  "設定温度": [10, 111, 72, 18]
}

エアコン:Fl_Boxに"エアコン"を表示
AUTOボタン:ラベルが"AUTO"のFl_Button
OFFボタン:ラベルが"OFF"のFl_Button

動作温度:Fl_Boxに"動作温度"を表示
動作温度スライダー:Fl_Sliderを表示 26から28まで0.1きざみ
動作温度表示:Fl_Boxに動作温度スライダーの値を表示。

温度幅:Fl_Boxに"温度幅"を表示
温度幅スライダー:Fl_Sliderを表示 0.1から0.5まで0.1きざみ
温度幅表示:Fl_Boxに温度幅スライダーの値を表示。

設定温度:Fl_Boxに"設定温度"を表示
設定温度スライダー:Fl_Sliderを表示 20から25まで1.0きざみ
設定温度表示:Fl_Boxに設定温度スライダーの値を表示。

ファン:Fl_Boxに"ファン"を表示
ファン選択:ブルダウンで選択 # fan speed includes 1 (auto), 2 (low), 3 (medium), 4 (high);
エアコングラフ:pngファイルを表示[Mac M2 Pro 12CPU, Sonoma 14.5]
Pythonでエアコンを操作してみました。
このスクリプトを応用すれば、温湿度計のデータと連携させて0.1度単位でトリガーを設定し、エアコンを操作できるようになります。
純正アプリでは最小で0.5度の温度幅ですが、0.1度まで狭くすることが理屈では可能です。
ただ、SwitchBot APIへのコール回数は1日10000回までになっています。毎秒測定なら1日86400回になるので、10秒に1回程度に減らす必要があります。cronを使えば毎分が最多で1440回です。
import os
import time
import json
import hashlib
import hmac
import base64
import uuid
import requests
import datetime

dir_name = "/SwitchBot/data"

device_id = "XXX"
token = 'XXX'
secret = 'XXX'

# エアコン設定
temperature = 26.5
mode = 2 # modes include 0/1 (auto), 2 (cool), 3 (dry), 4 (fan), 5 (heat);
fanspeed = 1 # fan speed includes 1 (auto), 2 (low), 3 (medium), 4 (high);
power_state = "on" # power state includes on and off

nonce = str(uuid.uuid4())
t = int(round(time.time() * 1000))
string_to_sign = "{}{}{}".format(token, t, nonce)
string_to_sign = bytes(string_to_sign, "utf-8")
secret = bytes(secret, "utf-8")
sign = base64.b64encode(
    hmac.new(secret, msg=string_to_sign, digestmod=hashlib.sha256).digest()
)

HEADERS = {
    "Authorization": token,
    "Content-Type": "application/json",
    "charset": "utf8",
    "t": str(t),
    "sign": str(sign, "utf-8"),
    "nonce": nonce
}

# コマンド内容
command_body = {
    "command": "setAll",
    "parameter": f"{temperature},{mode},{fanspeed},{power_state}",
    "commandType": "command"
}

response = requests.post(
    f"https://api.switch-bot.com/v1.1/devices/{device_id}/commands",
    headers=HEADERS,
    data=json.dumps(command_body)
)

status = response.json()

timestamp = datetime.datetime.now().strftime("%Y%m%d%H%M%S")
response_file = f"{dir_name}/AirCon/status_{device_id}_{timestamp}.json"
with open(response_file, "w") as f:
    json.dump(status, f, ensure_ascii=False, indent=4)

print("Success operate Air Conditioner")[Mac M2 Pro 12CPU, Sonoma 14.5]
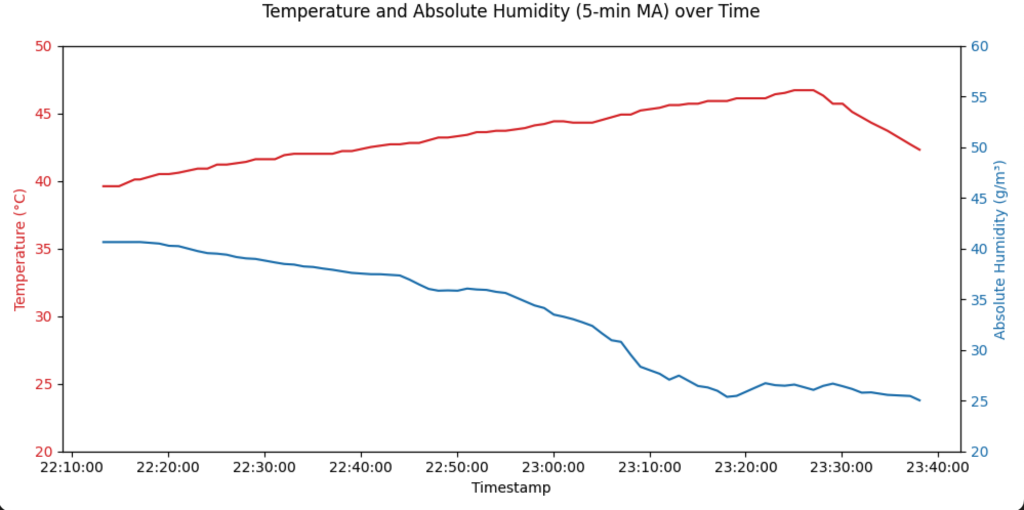
浴室暖房乾燥機で洗濯物を乾かす際の温湿度をモニタリングしました。途中何度か風呂場に素早く入って乾き具合をチェックしました。
絶対湿度33g/m3位で洗濯物が8割方乾いていたので回収し、残りは27g/m3まで下がった時点で完全に乾いていました。
製作するアプリでは絶対湿度33g/m3以下で最初の回収を促し、27g/m3以下で終了を合図するようにします。
物理的にボタンを押してくれるスマートスイッチがあれば、浴室のリモコンまで行かなくても乾燥を自動停止できます。
import os
import time
import json
import hashlib
import hmac
import base64
import uuid
import requests
import datetime
import pandas as pd
import matplotlib.pyplot as plt
from os.path import exists
import subprocess
import numpy as np

dir_name = "/SwitchBot/data"

device_id = "XXX"
token = 'XXX'
secret = 'XXX'

nonce = str(uuid.uuid4())
t = int(round(time.time() * 1000))
string_to_sign = "{}{}{}".format(token, t, nonce)
string_to_sign = bytes(string_to_sign, "utf-8")
secret = bytes(secret, "utf-8")
sign = base64.b64encode(
    hmac.new(secret, msg=string_to_sign, digestmod=hashlib.sha256).digest()
)

apiHeader = {}
apiHeader["Authorization"] = token
apiHeader["Content-Type"] = "application/json"
apiHeader["charset"] = "utf8"
apiHeader["t"] = str(t)
apiHeader["sign"] = str(sign, "utf-8")
apiHeader["nonce"] = nonce

response = requests.get(
    f"https://api.switch-bot.com/v1.1/devices/{device_id}/status",
    headers=apiHeader,
)
devices = response.json()

timestamp = datetime.datetime.now().strftime("%Y%m%d%H%M%S")
response_file = f"{dir_name}/json/status_{device_id}_{timestamp}.json"
with open(response_file, "w") as f:
    json.dump(devices, f, ensure_ascii=False, indent=4)

print("Success get device status.")

# CSVファイルを作成(データ行を追加する)
timestamp_date = datetime.datetime.now().strftime("%Y%m%d")
csv_file = f"{dir_name}/{timestamp_date}_{device_id}_data.csv"

# デバイスのステータスから必要なデータを抽出
temperature = devices['body']['temperature']
humidity = devices['body']['humidity']
battery = devices['body']['battery']

# 湿度が60%以下の場合に通知を送る(動作不可)
if humidity <= 60:
    subprocess.run(['osascript', '-e', f'display notification "Humidity is {humidity}%" with title "Humidity Alert"'])

# 絶対湿度を計算
absolute_humidity = (6.112 * np.exp((17.67 * temperature) / (temperature + 243.5)) * humidity * 2.1674) / (273.15 + temperature)

# CSVファイルにデータを追加
data = {
    'timestamp': [timestamp],
    'temperature': [temperature],
    'relative_humidity': [humidity],
    'absolute_humidity': [absolute_humidity],
    'battery': [battery]
}

df = pd.DataFrame(data)

if exists(csv_file):
    df.to_csv(csv_file, mode='a', header=False, index=False)
else:
    df.to_csv(csv_file, mode='w', header=True, index=False)

print("Success append data to CSV.")

# CSVファイルからグラフを作成する(上書き更新)
plot_file = f"{dir_name}/{timestamp_date}_{device_id}_data_plot.png"

# CSVファイルを読み込む
df = pd.read_csv(csv_file)

# タイムスタンプをdatetime型に変換
df['timestamp'] = pd.to_datetime(df['timestamp'], format='%Y%m%d%H%M%S')

# 絶対湿度の移動平均を計算(5分間の移動平均)
df.set_index('timestamp', inplace=True)
df['absolute_humidity_ma'] = df['absolute_humidity'].rolling('5T').mean()

# グラフを作成
fig, ax1 = plt.subplots(figsize=(10, 5))

ax1.set_xlabel('Timestamp')
ax1.set_ylabel('Temperature (°C)', color='tab:red')
ax1.plot(df.index, df['temperature'], label='Temperature', color='tab:red')
ax1.tick_params(axis='y', labelcolor='tab:red')
ax1.set_ylim(20, 50)

ax2 = ax1.twinx()
ax2.set_ylabel('Absolute Humidity (g/m³)', color='tab:blue')
ax2.plot(df.index, df['absolute_humidity_ma'], label='Absolute Humidity (5-min MA)', color='tab:blue')
ax2.tick_params(axis='y', labelcolor='tab:blue')
ax2.set_ylim(20, 60)

fig.tight_layout(rect=[0, 0, 1, 0.95])  # タイトルが切れないように調整
plt.title('Temperature and Absolute Humidity (5-min MA) over Time', pad=20)
plt.xticks(rotation=45)
ax1.xaxis.set_major_formatter(plt.matplotlib.dates.DateFormatter('%H:%M:%S'))

# グラフを保存
plt.savefig(plot_file)
plt.close()

print("Success create plot.")[Mac M2 Pro 12CPU, Sonoma 14.5]
浴室の温湿度データを毎分取得し、都度グラフ化するようにしました。
以前から解決できていなかったのですが、osascriptコマンドを使ってもMacに通知を送ることができません。システム音を鳴らすこともできないです。つまりAppleScriptが動作しないです。
このスクリプトをcronに登録するスクリプトが別に必要ですが、ChatGPTに聞けば教えてくれます。
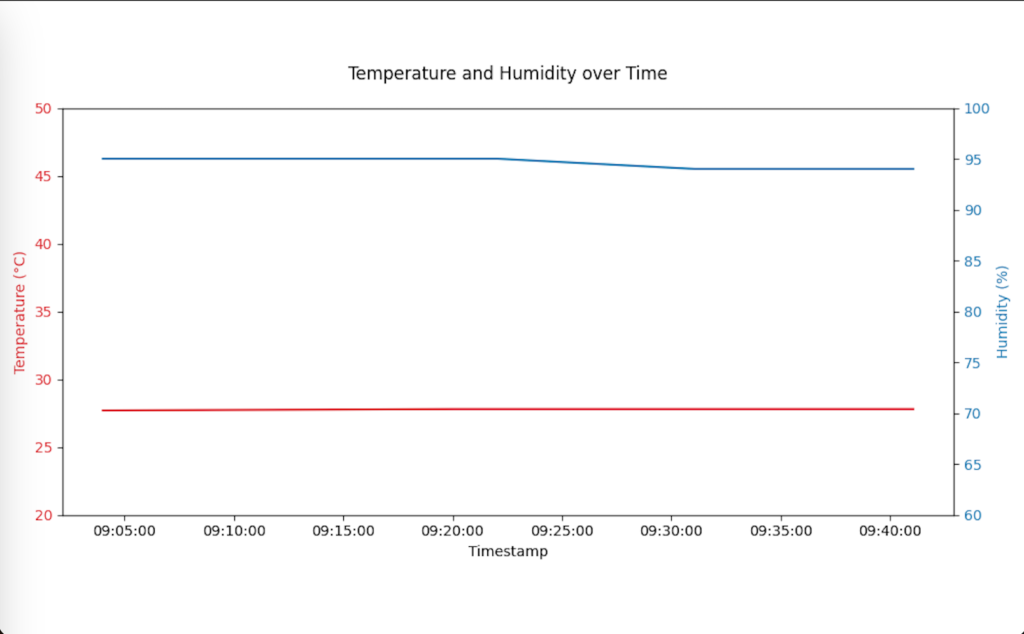
import os
import time
import json
import hashlib
import hmac
import base64
import uuid
import requests
import datetime
import pandas as pd
import matplotlib.pyplot as plt
from os.path import exists
import subprocess

dir_name = "/SwitchBot/data"

device_id = "XXX"
token = 'XXX'
secret = 'XXX'

nonce = str(uuid.uuid4())
t = int(round(time.time() * 1000))
string_to_sign = "{}{}{}".format(token, t, nonce)
string_to_sign = bytes(string_to_sign, "utf-8")
secret = bytes(secret, "utf-8")
sign = base64.b64encode(
    hmac.new(secret, msg=string_to_sign, digestmod=hashlib.sha256).digest()
)

apiHeader = {}
apiHeader["Authorization"] = token
apiHeader["Content-Type"] = "application/json"
apiHeader["charset"] = "utf8"
apiHeader["t"] = str(t)
apiHeader["sign"] = str(sign, "utf-8")
apiHeader["nonce"] = nonce

response = requests.get(
    f"https://api.switch-bot.com/v1.1/devices/{device_id}/status",
    headers=apiHeader,
)
devices = response.json()

timestamp = datetime.datetime.now().strftime("%Y%m%d%H%M%S")
response_file = f"{dir_name}/json/status_{device_id}_{timestamp}.json"
with open(response_file, "w") as f:
    json.dump(devices, f, ensure_ascii=False, indent=4)

print("Success get device status.")

# CSVファイルを作成(データ行を追加する)
timestamp_date = datetime.datetime.now().strftime("%Y%m%d")
csv_file = f"{dir_name}/{timestamp_date}_{device_id}_data.csv"

# デバイスのステータスから必要なデータを抽出
temperature = devices['body']['temperature']
humidity = devices['body']['humidity']
battery = devices['body']['battery']

# 湿度が60%以下の場合に通知を送る(動作不可)
if humidity <= 60:
    subprocess.run(['osascript', '-e', f'display notification "Humidity is {humidity}%" with title "Humidity Alert"'])

# CSVファイルにデータを追加
data = {
    'timestamp': [timestamp],
    'temperature': [temperature],
    'humidity': [humidity],
    'battery': [battery]
}

df = pd.DataFrame(data)

if exists(csv_file):
    df.to_csv(csv_file, mode='a', header=False, index=False)
else:
    df.to_csv(csv_file, mode='w', header=True, index=False)

print("Success append data to CSV.")

# CSVファイルからグラフを作成する(上書き更新)
plot_file = f"{dir_name}/{timestamp_date}_{device_id}_data_plot.png"

# CSVファイルを読み込む
df = pd.read_csv(csv_file)

# タイムスタンプをdatetime型に変換
df['timestamp'] = pd.to_datetime(df['timestamp'], format='%Y%m%d%H%M%S')

# グラフを作成
fig, ax1 = plt.subplots(figsize=(10, 5))

ax1.set_xlabel('Timestamp')
ax1.set_ylabel('Temperature (°C)', color='tab:red')
ax1.plot(df['timestamp'], df['temperature'], label='Temperature', color='tab:red')
ax1.tick_params(axis='y', labelcolor='tab:red')
ax1.set_ylim(20, 50)

ax2 = ax1.twinx()
ax2.set_ylabel('Humidity (%)', color='tab:blue')
ax2.plot(df['timestamp'], df['humidity'], label='Humidity', color='tab:blue')
ax2.tick_params(axis='y', labelcolor='tab:blue')
ax2.set_ylim(60, 100)

fig.tight_layout(rect=[0, 0, 1, 0.95])  # タイトルが切れないように調整
plt.title('Temperature and Humidity over Time', pad=20)
plt.xticks(rotation=45)
ax1.xaxis.set_major_formatter(plt.matplotlib.dates.DateFormatter('%H:%M:%S'))

# グラフを保存
plt.savefig(plot_file)
plt.close()

print("Success create plot.")[Mac M2 Pro 12CPU, Sonoma 14.5]
初めてSwitchBotデバイスを購入してからちょうど2年が経ちました。
Mac用の正式な管理アプリがなく、iPad版はMacではまともに動作しないので、自分でmacOSアプリを製作できないか調査しています。
APIを使ってデバイスからデータを取得し、ある条件を満たせばMacに通知を送信する機能を実装したいです。
